Chart 1: Win Percentage Over Time
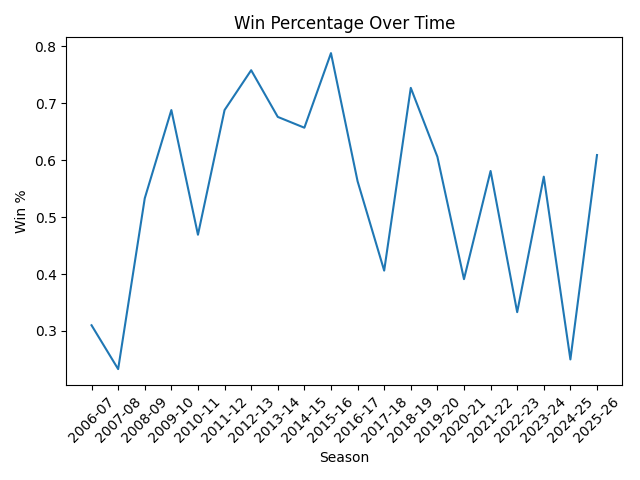
This chart shows how the team's performance changes over time. The team performs best around 2015–16 and drops significantly in later seasons.
This dataset shows team performance statistics across multiple seasons.
| Rk | Season | Conf | W | L | W-L% | W | L | W-L% | SRS | SOS | PS/G | PA/G |
|---|---|---|---|---|---|---|---|---|---|---|---|---|
| 1 | 2025-26 | CAA | 14 | 9 | 0.609 | 6 | 4 | 0.600 | -4.66 | -3.56 | 72.6 | 70.5 |
| 2 | 2024-25 | CAA | 8 | 24 | 0.250 | 4 | 14 | 0.222 | -13.84 | -4.42 | 66.5 | 74.1 |
| 3 | 2023-24 | CAA | 20 | 15 | 0.571 | 10 | 8 | 0.556 | -2.59 | -2.62 | 73.5 | 72.3 |
| 4 | 2022-23 | CAA | 11 | 22 | 0.333 | 6 | 12 | 0.333 | -12.45 | -4.13 | 63.1 | 69.1 |
| 5 | 2021-22 | AmEast | 18 | 13 | 0.581 | 10 | 8 | 0.556 | -6.63 | -5.43 | 72.9 | 73.1 |
| 6 | 2020-21 | AmEast | 9 | 14 | 0.391 | 7 | 9 | 0.438 | -6.14 | -4.73 | 66.2 | 65.6 |
| 7 | 2019-20 | AmEast | 20 | 13 | 0.606 | 10 | 6 | 0.625 | -2.41 | -4.41 | 69.2 | 65.8 |
| 8 | 2018-19 | AmEast | 24 | 9 | 0.727 | 12 | 4 | 0.750 | -2.10 | -6.48 | 71.6 | 66.3 |
| 9 | 2017-18 | AmEast | 13 | 19 | 0.406 | 7 | 9 | 0.438 | -5.08 | -2.28 | 68.9 | 70.3 |
| 10 | 2016-17 | AmEast | 18 | 14 | 0.563 | 12 | 4 | 0.750 | -4.71 | -5.05 | 69.2 | 68.9 |
| 11 | 2015-16 | AmEast | 26 | 7 | 0.788 | 14 | 2 | 0.875 | 3.75 | -5.28 | 76.2 | 64.1 |
| 12 | 2014-15 | AmEast | 23 | 12 | 0.657 | 12 | 4 | 0.750 | -0.03 | -4.03 | 65.4 | 60.1 |
| 13 | 2013-14 | AmEast | 23 | 11 | 0.676 | 13 | 3 | 0.813 | -1.71 | -6.47 | 71.4 | 66.3 |
| 14 | 2012-13 | AmEast | 25 | 8 | 0.758 | 14 | 2 | 0.875 | 5.61 | -4.11 | 68.0 | 57.5 |
| 15 | 2011-12 | AmEast | 22 | 10 | 0.688 | 14 | 2 | 0.875 | -0.45 | -6.22 | 66.4 | 59.1 |
| 16 | 2010-11 | AmEast | 15 | 17 | 0.469 | 8 | 8 | 0.500 | -6.85 | -6.20 | 61.0 | 60.4 |
| 17 | 2009-10 | AmEast | 22 | 10 | 0.688 | 13 | 3 | 0.813 | -3.64 | -7.64 | 68.9 | 64.0 |
| 18 | 2008-09 | AmEast | 16 | 14 | 0.533 | 8 | 8 | 0.500 | -4.82 | -6.49 | 65.0 | 60.9 |
| 19 | 2007-08 | AmEast | 7 | 23 | 0.233 | 3 | 13 | 0.188 | -12.36 | -6.50 | 61.2 | 66.6 |
| 20 | 2006-07 | AmEast | 9 | 20 | 0.310 | 4 | 12 | 0.250 | -10.30 | -5.55 | 59.9 | 64.3 |
AI disclose: I used AI to help me format the HTML and CSS for this page. I reviewed and edited all AI-generated content to ensure accuracy and clarity.